Module 1: AI Adoption Playbook
By the end of this module, you will know where your org stands on the adoption curve and what it costs to move up. You will also know how to run a rollout that shows a return instead of a usage number.
- 1.1Five Steps of AI Adoption from Anthropic's Boris Cherny
- 1.2AI maturity model for engineering teams
- 1.3The #1 mistake CTOs make after rolling out coding agents
- 1.4What outcome metrics should you track
- 1.5How to build AI into team workflows so the gains add up
- 1.6How to take AI coding tools from a few engineers to your whole org
Five Steps of AI Adoption from Anthropic’s Boris Cherny
Boris Cherny, who leads Claude Code at Anthropic, sees the same pattern in company after company. One engineer 10xs their output while the rest of the org lags. He mapped the five steps of AI adoption that teams move through. Find your step below. Click it for your bottleneck, what the step looks like, and how to get to the next one:
Step 1You are here: security and approval gates keep agents out
Your bottleneck. Legacy security and approval processes block you. The organization focuses on cost containment instead of outcomes, and true technical voices are missing from the decisions.
What it looks like. Your teams can only use older or lighter models. Latency compounds through gateways and custom auth. Nobody governs MCP, and AI-created code has no place to run, so outputs live on laptops.
How to get to the next step. Align your executives and your buyers, and escalate the blockers.
Step 2Go from gated approvals to one engineer paired with one agent
Your bottleneck. Your attention is the limit. Trust is low and the agent cannot verify itself, so all work is synchronous.
What it looks like. Each engineer runs one supervised session at a time and reviews almost every change before it merges.
How to get to the next step. Run more than one agent. Build a self-verification loop you trust. Switch to auto mode instead of permission prompts, and add automated code review.
Step 3Go from one agent per engineer to ten agents running in parallel
Your bottleneck. Review of output is the limit. Each engineer checks several streams instead of writing one, and steers across sessions.
What it looks like. Each engineer runs 5 to 10 agents, each on its own worktree. The agent runs tests, build, lint, and security scan before anyone sees the work, and the engineer reviews final diffs.
How to get to the next step. Give agents context from code, wikis, and discussions that other teams own. Break work into loops and routines. Let agents kick off agents.
Step 4Go from ten agents you review to agents that write nearly all the code
Your bottleneck. Trust in the loop and your team’s decision throughput are the limit. Your trap is to scale agent count before the loop earns widespread trust. Token efficiency now needs monitoring.
What it looks like. The agent writes nearly all the code, and cleanup runs continuously. The question changes from did you read the code to what context the model lacked and how you fix that for next time.
How to get to the next step. Scale automation across domain-specific use cases, such as code migration.
Step 5Go from supervised autonomy to a closed loop you monitor by exception
Your bottleneck. You have to identify and automate work at scale, with the right guardrails for each type of work.
What it looks like. The loop is closed. Agents kick off most agents, and you monitor by exception.
“There’s no one right path through the steps. Every team and company is different.
But at each step, tokens aren’t enough to move you forward: to get to the next step, you need to find and break down the next set of bottlenecks, and build up the next set of guardrails.”
AI maturity model for engineering teams
Five stages of AI maturity separate a team that experiments on personal accounts from an org where AI runs end-to-end workflows.
In this lesson, the AI maturity model for engineering teams helps you find your stage and measure the capabilities that move you up.
The five stages of AI maturity in engineering teams
- Ad Hoc Adoption. Individuals experiment with personal accounts, with no policies, training, or access to internal code.
- Assisted Development. You have centralized tools and early policies. Developers trigger AI manually and supply most of the context themselves.
- Standardized Workflows. AI sits in multiple SDLC workflows with shared processes and guardrails, and automated checks begin to validate its work.
- Supervised Automation. Agents handle bounded, lower-complexity tasks on their own and retrieve internal context. Humans oversee the higher-risk decisions.
- End-to-End Autonomy. AI orchestrates multi-step workflows across systems. If your org lacks strong governance, it invites a ripple effect of failures.
Why stage 3 or 4 might be optimal in comparison to stage 5
Risk on the five-stage maturity model is U-shaped.
It is high at stage 1, where individuals run AI on personal accounts with no policy. It falls to low at stages 2 and 3 and rises to medium at stage 4.
At stage 5 it returns to high, because failures cascade across systems.
Greater AI maturity does not always lead to better outcomes. For many engineering organizations, the optimal near-term target may be stage 3 or stage 4. These stages have standardized workflows and supervised automation, with humans still over the risky decisions.
How to score your org on the six capabilities
To find your stage, score six capabilities from 1 to 5 and take the average. Focus on averages, not outliers because strong capability does not lift the stage.
| Capability | What you score |
|---|---|
| Enablement | Learning and skill development for engineers |
| Policy and governance | Organizational guidance and guardrails for AI use |
| Validation and testing | Quality checks on AI-generated work |
| Embedding in workflows | How far AI sits inside developer workflows |
| Workflow automation | How much of the development workflow AI runs on its own |
| Data context and access | Internal data available to AI systems |
The average places you on a stage. The two lowest scores are the gaps that hold you there.
Goal: Score your org on the six capabilities and find the two gaps that block the next stage.
- Ask each engineering manager to score the six capabilities for their team from 1 to 5. Use this prompt with your coding agent to turn the replies into a table:
Prompt
Here are survey replies from engineering managers. Each reply gives six capability scores (1-5): enablement, policy and governance, validation and testing, embedding in workflows, workflow automation, data context and access. Produce a table with one row per team, plus an org-average row. Then list the two lowest-scoring capabilities for the org. Do not add recommendations. - Read the org-average row against the five stages. Mark the stage.
- For each of the two lowest capabilities, write the one investment that lifts it by a point.
- Put both investments on the roadmap for the next stage, with an owner each.
Expected result: one stage number, the two weakest capabilities, and one owned investment against each.
The #1 mistake CTOs make after rolling out coding agents
Every team that adopts a new tool loses time to learning before the tool returns value. The mistake is to read that dip as failure and pull the funding before the return arrives.
The dip has a shape, the J-curve. It also has a price, and you can put that price in the budget before the dip starts.
Google’s DORA research names three systemic factors behind the dip:
- The learning curve. Teams take time away from feature delivery to learn new interfaces and adapt their daily workflows. They move from prompts to systems built on context, intent, and specification.
- The verification tax. Developers spend time on review of generated code because they do not yet trust the output and worry about hallucinations. The tools also raise the sheer volume of code, which expands the review burden needed to meet security and architectural standards.
- Pipeline adaptation. As developers generate code faster, downstream processes such as testing and change approval must scale to the volume. This reveals legacy constraints to clear.
The dip is the tuition cost of transformation, a necessary investment in learning rather than a signal of failure. Initiatives often fail because leadership misreads this learning phase as failure and pulls funding during the dip, not because the technology fails.
How to price the dip in salary dollars in your business case
A J-curve cost is the salary spent on the productivity you lose during the learning period.
The report’s sample calculator puts numbers on the J-curve for a 500-engineer organization. The inputs and the outputs:
| Line item | DORA’s sample value |
|---|---|
| Technical staff | 500 FTE |
| Fully loaded salary | $176,000 |
| J-curve productivity drop | 15% for three months |
| J-curve cost | $3.3M |
| Total first-year investment (hard costs plus J-curve) | $8.4M |
| Total first-year return | $11.6M |
| First-year ROI | 39% |
| Payback period | 0.7 years, about eight months |
The calculator also builds in an instability tax. The effect of AI on instability was the second largest the research measured, larger than its effects on organizational performance or code quality.
| Instability tax in the sample | Value |
|---|---|
| Change failure rate before | 5% |
| Change failure rate after | 6% |
| Negative value added to the return | $344K |
The value side counts time saved as headcount reinvestment capacity rather than as salary removed. Do not adopt a headcount-reduction strategy. It damages morale, can reduce efficiency, and can even push engineers to stop improving their work processes.
The payback benchmark: 6 to 9 months is a highly successful target for agile teams. For larger enterprise rollouts with heavy governance, 12 to 18 months is acceptable. The first year carries the tuition phase, so cumulative return may trail cumulative investment at year end. The unrecovered amount rolls into year two.
Run three scenarios.
| Scenario | Value multiplier | Cost multiplier | Assumption |
|---|---|---|---|
| Conservative | Below 1, for example 0.8 | Above 1, for example 1.5 | Covers hidden integration overhead and code review bottlenecks |
| Base | 1.0 | 1.0 | |
| Optimistic | 1.2 | 0.8 | The internal platform is mature enough to absorb the tools without heavy verification overhead |
The interactive version is the Google DORA ROI calculator.
Goal: Produce a three-scenario J-curve budget for your organization in one sitting.
- Open the DORA ROI of AI calculator.
- Replace the sample inputs with yours: staff size, fully loaded salary, license and training cost, current deploys per year, and change failure rate.
- Set the J-curve drop at 15% for three months for the base case. Record the first-year ROI and payback period.
- Run the conservative case with value at 0.8 and cost at 1.5. Run the optimistic case with value at 1.2 and cost at 0.8.
- Put the three payback periods next to the enterprise benchmark of 12 to 18 months.
Expected result: three payback periods on one line, and a J-curve cost in dollars that appears in the budget before the dip arrives.
What outcome metrics should you track
Your AI dashboard shows license counts, active users, and prompt volume. All three can rise for a year while delivery stays flat, because they measure use, not return.
A study of 500 organizations shows what that gap looks like at industry scale:
Finding 1Speed gains are real but uneven
What rose or improved. Median weekly TrueThroughput rose 37% over four quarters. TrueThroughput is DX’s measure of pull requests weighted by size.
What fell or stayed flat. Developers’ perceived rate of delivery stayed flat at 67% to 70% all year.
Finding 2AI improves some work and creates new bottlenecks elsewhere
What rose or improved. Documentation quality, code maintainability, and production debugging improved.
What fell or stayed flat. Incremental delivery, local iteration speed, and review turnaround fell. The Developer Experience Index dropped from 67 to 65, and PR size nearly doubled.
Finding 3Code is easier to read but harder to trust
What rose or improved. Maintainability.
What fell or stayed flat. Change confidence fell, and the change failure rate became more volatile.
Finding 4Spend is outrunning the return it is meant to justify
What rose or improved. Median quarterly AI spend went from about $1.5K to about $44K in a year, 28x in the tech sector.
What fell or stayed flat. The innovation ratio, new features against maintenance, stayed flat at 57% to 58%.
Pipeline acceleration and felt speed no longer move together. Time savings are real and now exceed 6 hours a week on average. But saved hours are not yet visibly converting into new value at the portfolio level.
Then what utilization number do you pay attention to?
DAU/WAU: The ratio of daily to weekly active users inside your own organization.
A high DAU/WAU ratio means engineers use AI in their routine workflows. A low ratio, high weekly and low daily, means developers experiment but do not yet use AI in their core development loop.
A license count measures access; utilization measures how many license holders use the tool each week, and that is the number that moved last year. Faros measured the shift against its prior dataset:
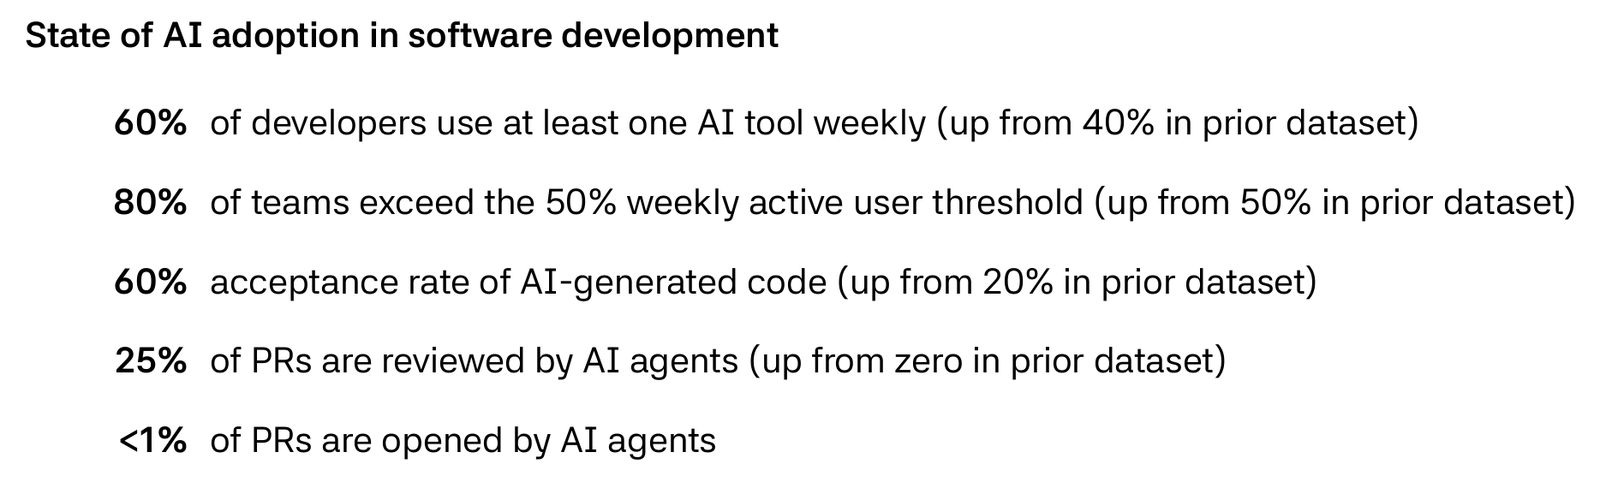
Pareto Principle in engineering teams
An organization-wide average hides where AI gains land.
McKinsey senior partners surveyed 334 product and engineering leaders. They define meaningful acceleration as more than a quarter of a leader’s teams at twofold or greater productivity gains.
Adoption metrics such as licenses, daily active users, prompt volume, or share of AI-generated code show whether people use the tools. They do not show whether releases are faster, more reliable, safer, or more valuable.
Top-accelerating organizations are much more likely to measure quality, time to market, security, reliability, cost, employee experience, and customer impact. 86% of them track outcome metrics such as quality, productivity, and speed, while low-accelerating organizations lean on tool adoption as their north star.
Why making AI usage a target makes engineers optimize the wrong thing
Preply drove 90% adoption of AI coding and treats usage metrics as signals, not goals. Never use them as targets. Turning them into goals optimizes for the wrong thing.
Adoption has natural ceilings and diminishing returns as a metric, so Preply now measures delivery speed, cycle time, and quality.
“Usage is worth watching (e.g. a dashboard), but it measures activity, not return. A better question: would you have spent engineering effort on this anyway? If yes, how much and what would it have cost in manual eng-hours? That’s your return.”
Goal: Replace one adoption number on your AI dashboard with one return number, in under an hour.
- Pull your daily and weekly active AI tool users for the last four weeks. Compute the DAU/WAU ratio per team.
- Mark the teams with a low ratio. Those teams experiment but do not yet use AI in their core loop.
- Pick one team with a high ratio. Ask its lead Cherny’s question for their last five AI-assisted pieces of work:
Prompt
For each of your last five AI-assisted tasks: 1. Would we have spent engineering effort on this anyway? (yes / no) 2. If yes, what would it have cost in manual engineering hours? 3. What did it actually cost, including review and rework? - Add the totals to the dashboard next to the usage number.
Expected result: one team with a return figure in engineering hours, sitting beside the usage figure that used to stand alone.
How to build AI into team workflows so the gains add up
AI amplifies how the team already works. A team with clean handoffs, fast pipelines, and clear ownership gets faster. A team without them gets faster at producing work that waits.
This lesson covers how to fit AI into the way teams work and what to fix around them first. Plus what a CTO still has to hold in place while the tools change.
What Google’s DORA 2025 survey found about AI in teams
Google’s DORA 2025 survey found the same thing at industry scale. AI magnifies the strengths of high-performing organizations and the dysfunctions of struggling ones. Three more findings from the same report, with the numbers and what they mean:
Finding 1Engineers use AI, trust it less, and that is healthy
The numbers. 90% of respondents use AI at work, and more than 80% believe it raised their productivity. 30% report little to no trust in AI-generated code.
What it means. A trust-but-verify stance is a sign of mature adoption.
Finding 2AI now raises throughput and still raises instability
The numbers. AI adoption improves delivery throughput, a shift from 2024. It still increases delivery instability.
What it means. Underlying systems have not yet evolved to manage AI-accelerated development safely.
Finding 3Platform engineering decides whether AI pays off
The numbers. 90% of organizations have adopted platform engineering.
What it means. Prioritize and fund your platform engineering initiatives. A poor developer experience and fragmented tooling can hamper the impact of your AI strategy.
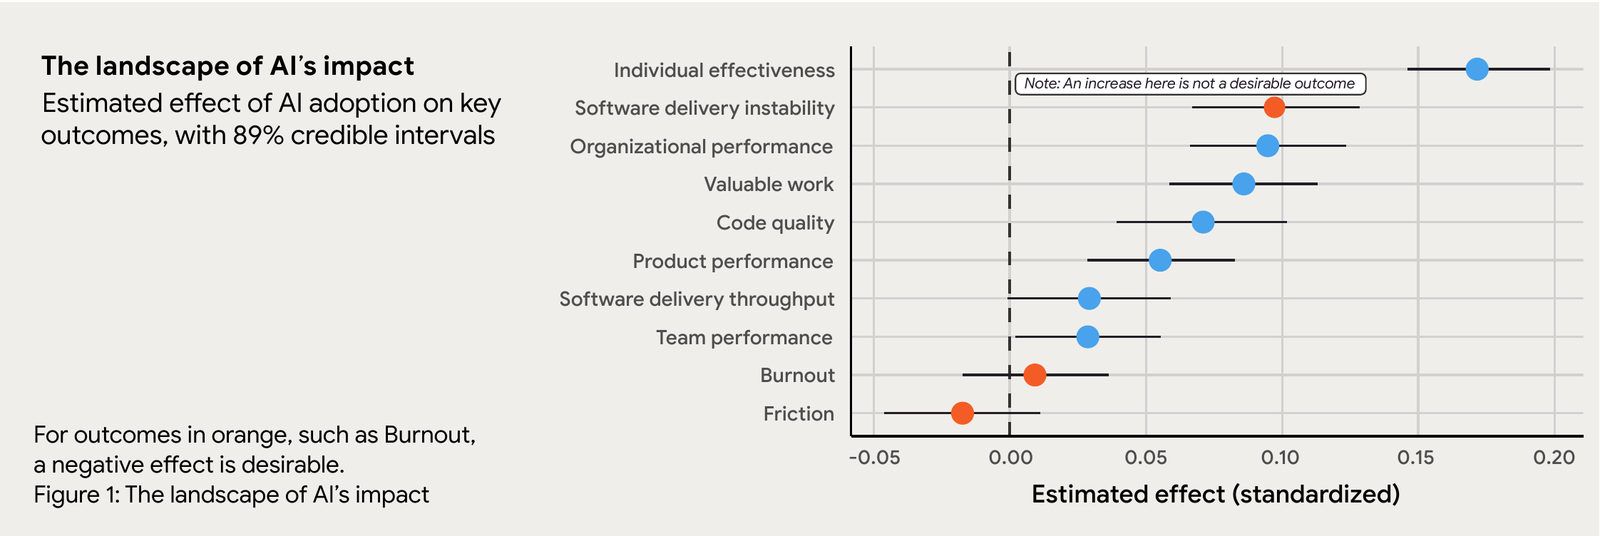
Seven capabilities that amplify AI’s effect
A capability amplifies AI when teams that pair it with AI adoption see a larger effect than teams that adopt AI alone. The pairing tells you where to invest so the tools have something to multiply.
DORA’s researchers built the AI Capabilities Model from 78 in-depth interviews and a survey of 15 candidate capabilities. Seven showed substantial evidence of interaction with AI use. Each pairs with the outcome it amplifies:
A user-centric focus amplifies AI’s positive influence on team performance. Without it, AI adoption has a negative impact on team performance.
Why individual AI speed gains do not raise team throughput
A mirror shows an organization what it already is. When individual gains do not add up at the team level, the system between the individuals is the limit.
GitHub’s research advisor wrote the report’s chapter on the AI mirror. To scale AI from individual gains to organizational benefits, think in systems. Organizations are less like sums of individuals and more like interconnected wholes.
Augmenting: prepare systems to carry the gains. When developers get faster but teams see no matching rise in throughput, the system itself is the limit. Five places to look:
- Code reviews and handoffs. AI-generated first-pass reviews and structured summaries of diffs make human review faster.
- Integration and deployment pipelines. AI-generated code moves fast. Pipelines may need to shed wait states and allow higher-frequency delivery.
- Data infrastructure. Internal data amplifies AI’s benefits for productivity and code quality, so connect the tools to repos, work tracking, documentation, decision logs, and communication tools.
- Security and privacy protocols. Put in place secure tool usage, updated policies, and AI-aware monitoring that maintains trust without new bottlenecks.
- Change management and cultural alignment. Leaders articulate the long-term goal, whether innovation, velocity, or quality, and reward verification, delegation, prompt curation, and agent orchestration.
How to order AI funding: platform and data first, then training, then indicators
A funding plan orders investments so that the later ones have something to build on. The order below puts context and data before people and metrics.
DORA’s ROI report turns the capabilities into a funding plan around five keys: trust, platform, data, users, and guardrails. The roadmap sequences the spend:
- Build the context layer (CapEx). Build a quality internal platform and a healthy data ecosystem first. In an agentic world, garbage in, garbage out refers to the context you give the agent. Centralize architectural standards and make documentation high fidelity and machine readable.
- Empower the human in the loop (OpEx). Build trust in AI and skill in context engineering. The cost of adoption is highest when developers struggle to verify agentic output. Spend on training for context engineering and verification so developers act as orchestrators.
- Validate progress with leading indicators. Watch experiment frequency and deployment frequency before you look for lagging financial returns. Use change failure rate and rework as the stability gauge.
Why teams that redesigned roles and processes gained more than teams that added tools
Top accelerators are the organizations where more than a quarter of teams doubled productivity. What separates them from the rest is that they changed the process, the roles, and the controls, and did not only add tools.
McKinsey found four themes among organizations ahead of the curve:
- They reimagine end-to-end processes rather than plug AI into existing ways of working.
- They change team structures and roles to focus on human judgment and product intent.
- They build verification, control, and measurement systems that keep pace.
- They invest heavily in hands-on upskilling.
In short, they use AI to redesign the whole system of product development.
On process: organizations that redesigned processes before they added AI were more than twice as likely to report productivity gains above 20 percent. Organizations that layered AI onto existing ways of working were not. Strong adoption and best practices without reshaped workflows tend to miss out on meaningful impact.
On roles: the teams that embedded AI and redesigned roles and work are the transformers. Role changes are an underappreciated lever.
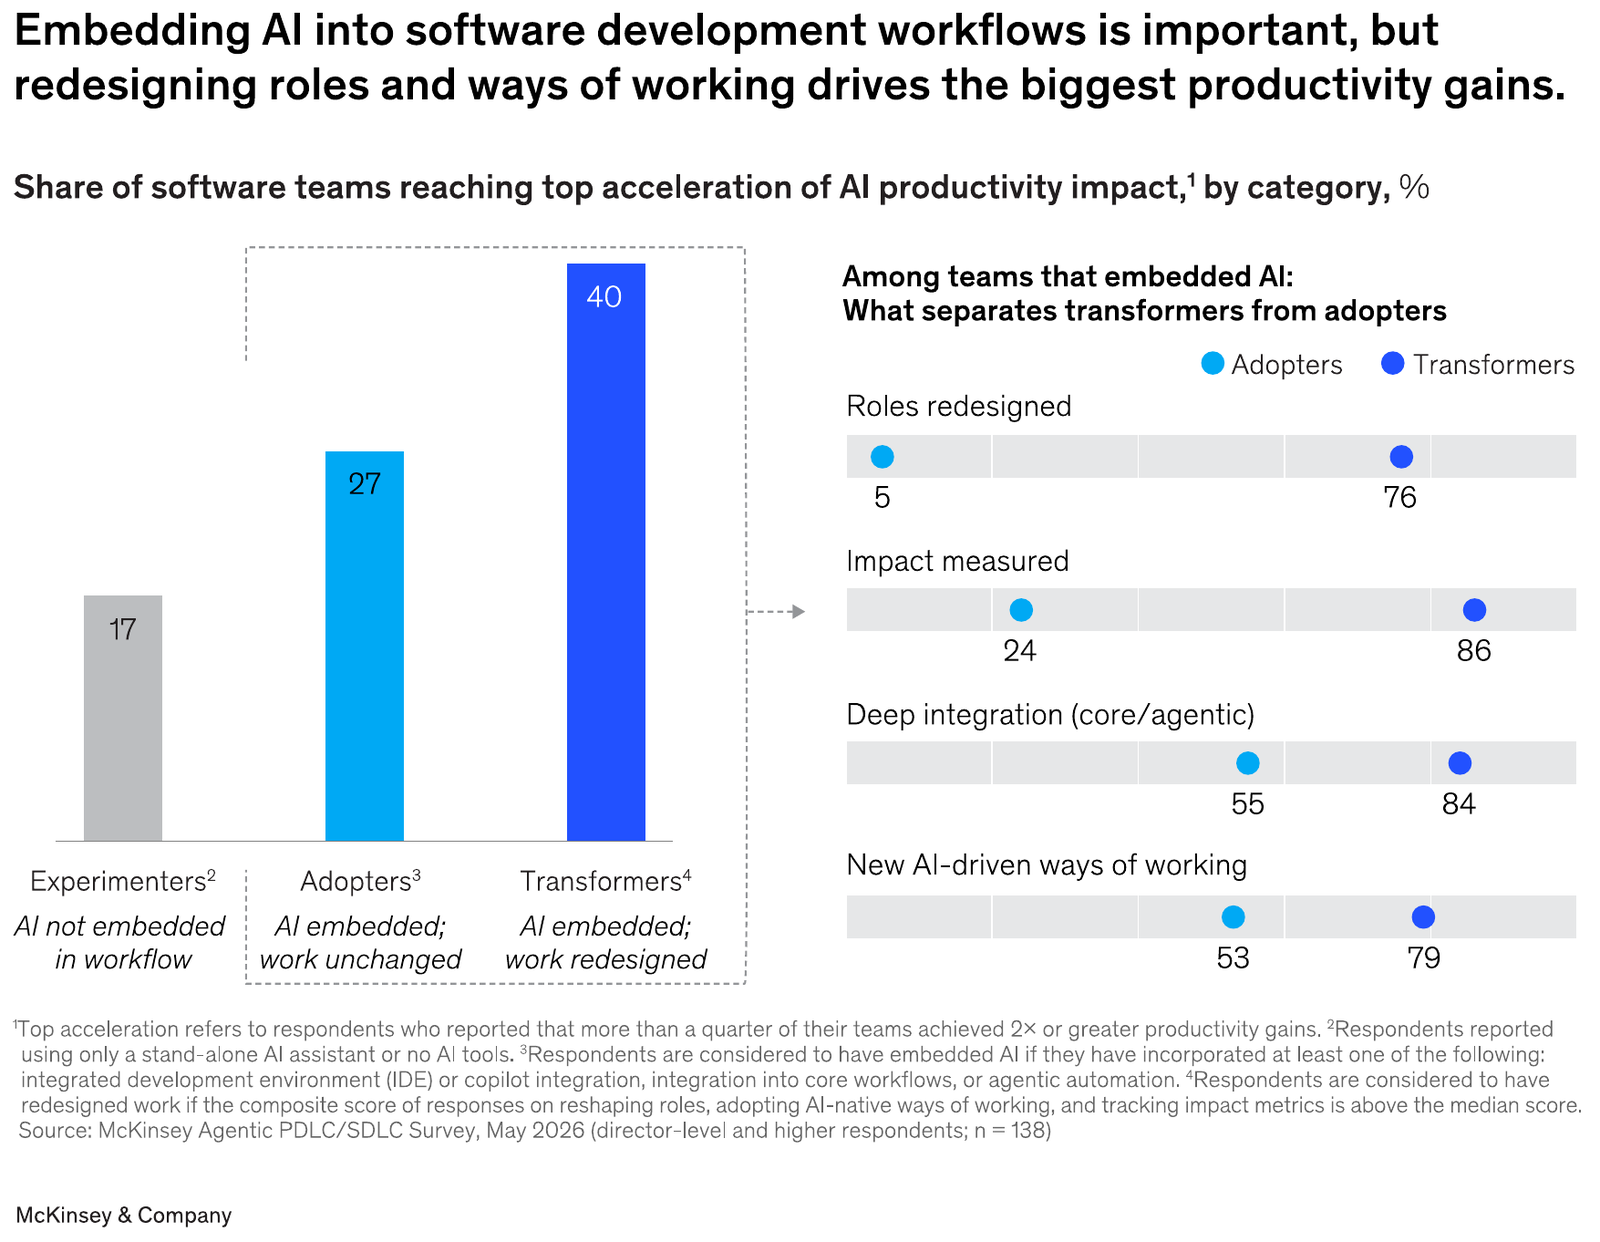
On control: the outperforming cohort treats orchestration and evaluation as foundational. The progress marker is that leaders can see agent activity, cost, risk, and output through a single control plane.
CTO to CTO: Why your code still needs tests, CI/CD, and fast decision
Will Larson, CTO at Imprint, revised his rules of engineering leadership after a year of agent adoption. Three of the five change what a CTO funds:
- First-pass code is nearly free, but working code is not. Its cost depends on your development harness. The tests, CI/CD, validation environments, and preview-ability that sped up engineering two years ago are still what speed it up today.
- Durable, high-ownership teams with domain context are even more important. High-judgment individuals can wander across a company doing remarkable things, but at some point a lack of domain context hems them in.
- Quick, good, and durable decision-making is a prerequisite to meaningfully benefit from AI. The CTO is often the only person who can make a binding decision when teams disagree, so the CTO decides constantly to maintain the pace.
What the harness now allows: one engineer can run a migration that used to take a team, as in Imprint’s deploy migration.
| Imprint’s deploy migration | Figure |
|---|---|
| Deploys per week before | About 6 |
| Deploys per week after | 200 to 400 |
| Duration | Two months |
| Share done by two infrastructure engineers | 90% |
How to standardize the LLM gateway and repo context while teams pick tools
A shared platform layer lets teams pick different tools while the company keeps one place for cost, analytics, and model choice. Repo-level context does the same job for agents inside a codebase.
Shopify’s VP and head of engineering described the platform layer in Bessemer’s account of Shopify’s playbook. The rule: standardize infrastructure, not tools.
A central LLM proxy routes every AI request through one gateway. Engineers use Claude Code, GitHub Copilot, and other tools at once. The company keeps cost control and usage analytics central and swaps models as prices change. The MCP servers behind it must meet the same reliability and testing standards as any other internal system.
Block’s head of AI enablement for engineering, Angie Jones, described the repo-level equivalent. Champions made each repo AI-readable before rollout, so a monorepo of 40,000-plus source files and 650 services inherits root context.
Most engineers could then use AI-assisted tools comfortably without much training, because the champions laid the foundation at the repo level first.
Goal: Find the one constraint in your system that AI amplifies, in one working session with your platform lead.
- Score your organization 1 to 5 on each of DORA’s seven capabilities. Use the figure above.
- For the two lowest scores, walk the five augmenting points and mark where each shows up: review, pipeline, data, security, or change management.
- Paste the scores and marks into your coding agent with this prompt:
Prompt
Here are our scores (1-5) on DORA's seven AI capabilities, and the two lowest mapped to the augmenting areas where the friction appears. Using DORA's Figure 45 pairing (capability -> amplified outcome), state which outcome our two lowest capabilities are suppressing. Then list the specific system in our stack that a platform team would change first for each. Do not add general advice. - Take the first item on the list to your next platform prioritization meeting.
Expected result: two capabilities named, two outcomes they suppress, and one concrete platform change queued.
The Code: Your daily unfair advantage in software engineering.
Join 350,000+ software engineers, tech leads, and CTOs who start their morning with The Code.
How to take AI coding tools from a few engineers to your whole org
Block gave 50 engineers 30% of their time to make repos agent-ready. Three months later, AI-authored code was up 69% and automated PRs were up 21x.
Angie Jones, who leads AI Enablement for Engineering at Block, ran the rollout in three moves:
Move 1: Provide the freedom to explore
Models and tools changed weekly through 2025 with no clear winner, so Block did not standardize. “It would be foolish to lock in to any specific tool or model. So, we buy them all. Well, not all, but a lot!”
Move 2: Launch a champions program
In August 2025 Jones launched an Engineering AI Champions program with 50 developers from different teams. Each had 30% of their time for AI enablement at the repo level. These were resilient engineers. When the AI hallucinated or produced slop, they leaned in to find out why it failed and did the engineering work to make it succeed.
The champions worked in three layers:
- Repo readiness. Make each repo discoverable and consumable by agents. Developer Relations gamified it as Repo Quest. Its tiers walk a repo through context files, reusable skills, automated AI review, headless agents that fix CI, and measurement. The checklist is in Try This Today below.
- Context engineering. Block adopted Research → Plan → Implement, a technique from HumanLayer, for work too complex for standard prompting. It prevented the usual AI drift.
- Automated PRs. Champions assigned agents well-understood, low-complexity tickets from Linear and Jira. The agent plans, branches, writes the code, opens the PR, and fixes its own CI failures; humans step in at review time.
Block’s results within three months of launch:
Move 3: Training
Champions and Developer Relations ran brownbags, demos, and office hours, and built onboarding kits, repo templates, agent rules and skills, prompt libraries, and MCP servers. Jones credits peer transfer: “When an engineer on your team shows you how they used an agent to knock out a tedious migration in an afternoon, it hits different than a generic tutorial.”
What did not work at Block
Even with broad training, a noticeable gap opened between the AI champions and the rest of engineering. The training showed people what was possible, but it was not enough to get them to the next level. Watching a demo is one thing. Rewiring how you work is another.
Broad teaching will not close that gap, so DevRel now pairs with teams in workshops on their actual codebase and their actual work.
How four companies drove AI adoption without mandating tool use
Enablement-led rollouts rely on tooling quality, peer example, and training to pull engineers in. Click each company for what it did and the result:
ShopifyLeaders show their own AI work, and performance reviews reward it
What they did. Shopify’s VP and head of engineering told Bessemer that cultural adoption beats top-down mandates every time. Leaders share their own AI work, and the company supplies prompt libraries, setup guides, and MCP connections. The one hard incentive is that biannual performance reviews assess employees on how AI-reflexive they are.
The result. The progress signal is weekly demos rather than metrics.
PreplyA budget for any assistant, then enablement in sequence
What they did. Preply’s rollout ran on a budget for any assistant that showed promise, with engineers choosing their tools. Enablement ran in sequence: Cursor training on real codebase examples, a dedicated Slack channel, a hackathon, and AI champions. Then came repo-level guidance such as AGENTS.md, “Back to AI School” sessions on agents and context engineering, and hands-on sessions with vendors.
The result. Monthly active developers went from 33 in January 2025 to 133 in February 2026, with a largest single-month jump of 49.4%. The largest jump came from active leadership focus plus operational enablement, not from organic drift.
ImprintGood tooling and conversations with non-adopters
What they did. Imprint CTO Will Larson describes no top-down mandate at all. The company made the tooling good and talked with non-adopters to remove sources of friction.
The result. Engineers who used Claude Code or Cursor every day went from about 25% on the first day of January to 100% by the end of February.
IndeedA self-paced course with a suggested completion target
What they did. Indeed never set a mandate to use AI. It ran a self-paced course with a suggested completion target agreed with engineering leadership, plus spaces for continued engagement. The idea: the company cannot force engineers to use the tools, but engineers who try them through the training and like them keep using them.
The result. Adoption went from 25% to 97%, per the DX Q2 report’s sidebar.
Why each rollout needs a champion, a funding executive, and willing managers
According to Atlassian, you start with a team of three to five engineers on one repo.
Measure two to three months in, after novelty effects wear off. Each rollout above had a named person with time to run it, an executive who funded it, and managers who let their teams take part.
A champion without an executive gets politely ignored. An executive without a champion sends one email and moves on.
- Champion. 30% of a senior engineer’s time, per repo, for a quarter.
- Executive. Budget for several tools rather than one, and the business case for it.
- Manager. A team of three to five on one repo, measured at month three.
Make the business case in the executive’s own currency. Executives do not fund developer experience. They fund time to market, incident reduction, and their own goals.
Goal: Stand up the first rollout unit, one repo with a champion and a measurement date, in one week.
- Pick one repo with three to five engineers who will actively use the tool. Follow Atlassian’s rule: a team, not an individual.
- Name one champion on that team and give them 30% of their time for the quarter, in writing, agreed with their manager.
- Give the champion Block’s three-layer checklist for the repo:
Prompt
Repo readiness for AI agents [ ] AGENTS.md with build and test commands, style conventions, architecture patterns [ ] HOWTOAI.md as the human-facing guide: setup, tips, example workflows [ ] Reusable agent skills for the repo's common tasks [ ] Automated AI code review on PRs [ ] A headless agent that can pick up a ticket, open a PR, and fix its own CI failures [ ] A label or indicator on PRs where AI contributed significantly - Record today’s merged PRs per month and hours saved per week for the team.
- Put a calendar entry three months out to re-measure both numbers, per Atlassian’s novelty rule.
Expected result: one repo, one champion with protected time, a baseline, and a measurement date on the calendar.
By this point you should have:
- Every team placed on Cherny’s five steps, with one owned action against the org’s bottleneck.
- Your org scored on Quotient’s six capabilities, with its stage and the two gaps that hold it there.
- A three-scenario J-curve budget from DORA’s calculator, with a payback period against the enterprise benchmark.
- The three numbers that diverge on your AI dashboard, and one return figure to sit beside them.
- A score on DORA’s seven capabilities and the one system constraint AI amplifies.
- A first rollout unit: one repo, one champion, three to five engineers, and a re-measurement date.
Module 2: Measure Developer Productivity
How to measure what that rollout produced without misleading numbers. It covers the metrics that lie when read alone, the ones that hold up, and how the companies above read their own numbers.