Module 2: Measure Developer Productivity
By the end of this module, you will be able to set a productivity target you can defend. You will also keep review honest when agents write the code, and report numbers that hold up.
How days of use and peer adoption decide your AI gain
Your AI gain has two inputs you can manage. The first is how many days a week each engineer uses the tool. The second is whether the people around them use it too.
This lesson covers what the gain looks like at each level of use, and who adopts and keeps the tool. It ends with how to replace the number in your business case with one you can defend.
Why the merged-PR lift rises with days of tool use per week
A dose-response pattern means the effect grows with the amount of use. The same engineer merges more in a week of heavy tool use than in a week with none.
Microsoft studied its own rollout of Claude Code and GitHub Copilot CLI across tens of thousands of engineers. Adopters merged 24% more pull requests than the counterfactual predicted, and merged PRs say nothing about quality. The study compared tool-use weeks to zero-tool weeks within the same engineer:
Read this as an association, not a cause. Heavier-use weeks may carry a lighter task mix.
Why engineers adopt CLI coding agents when their peers and managers do
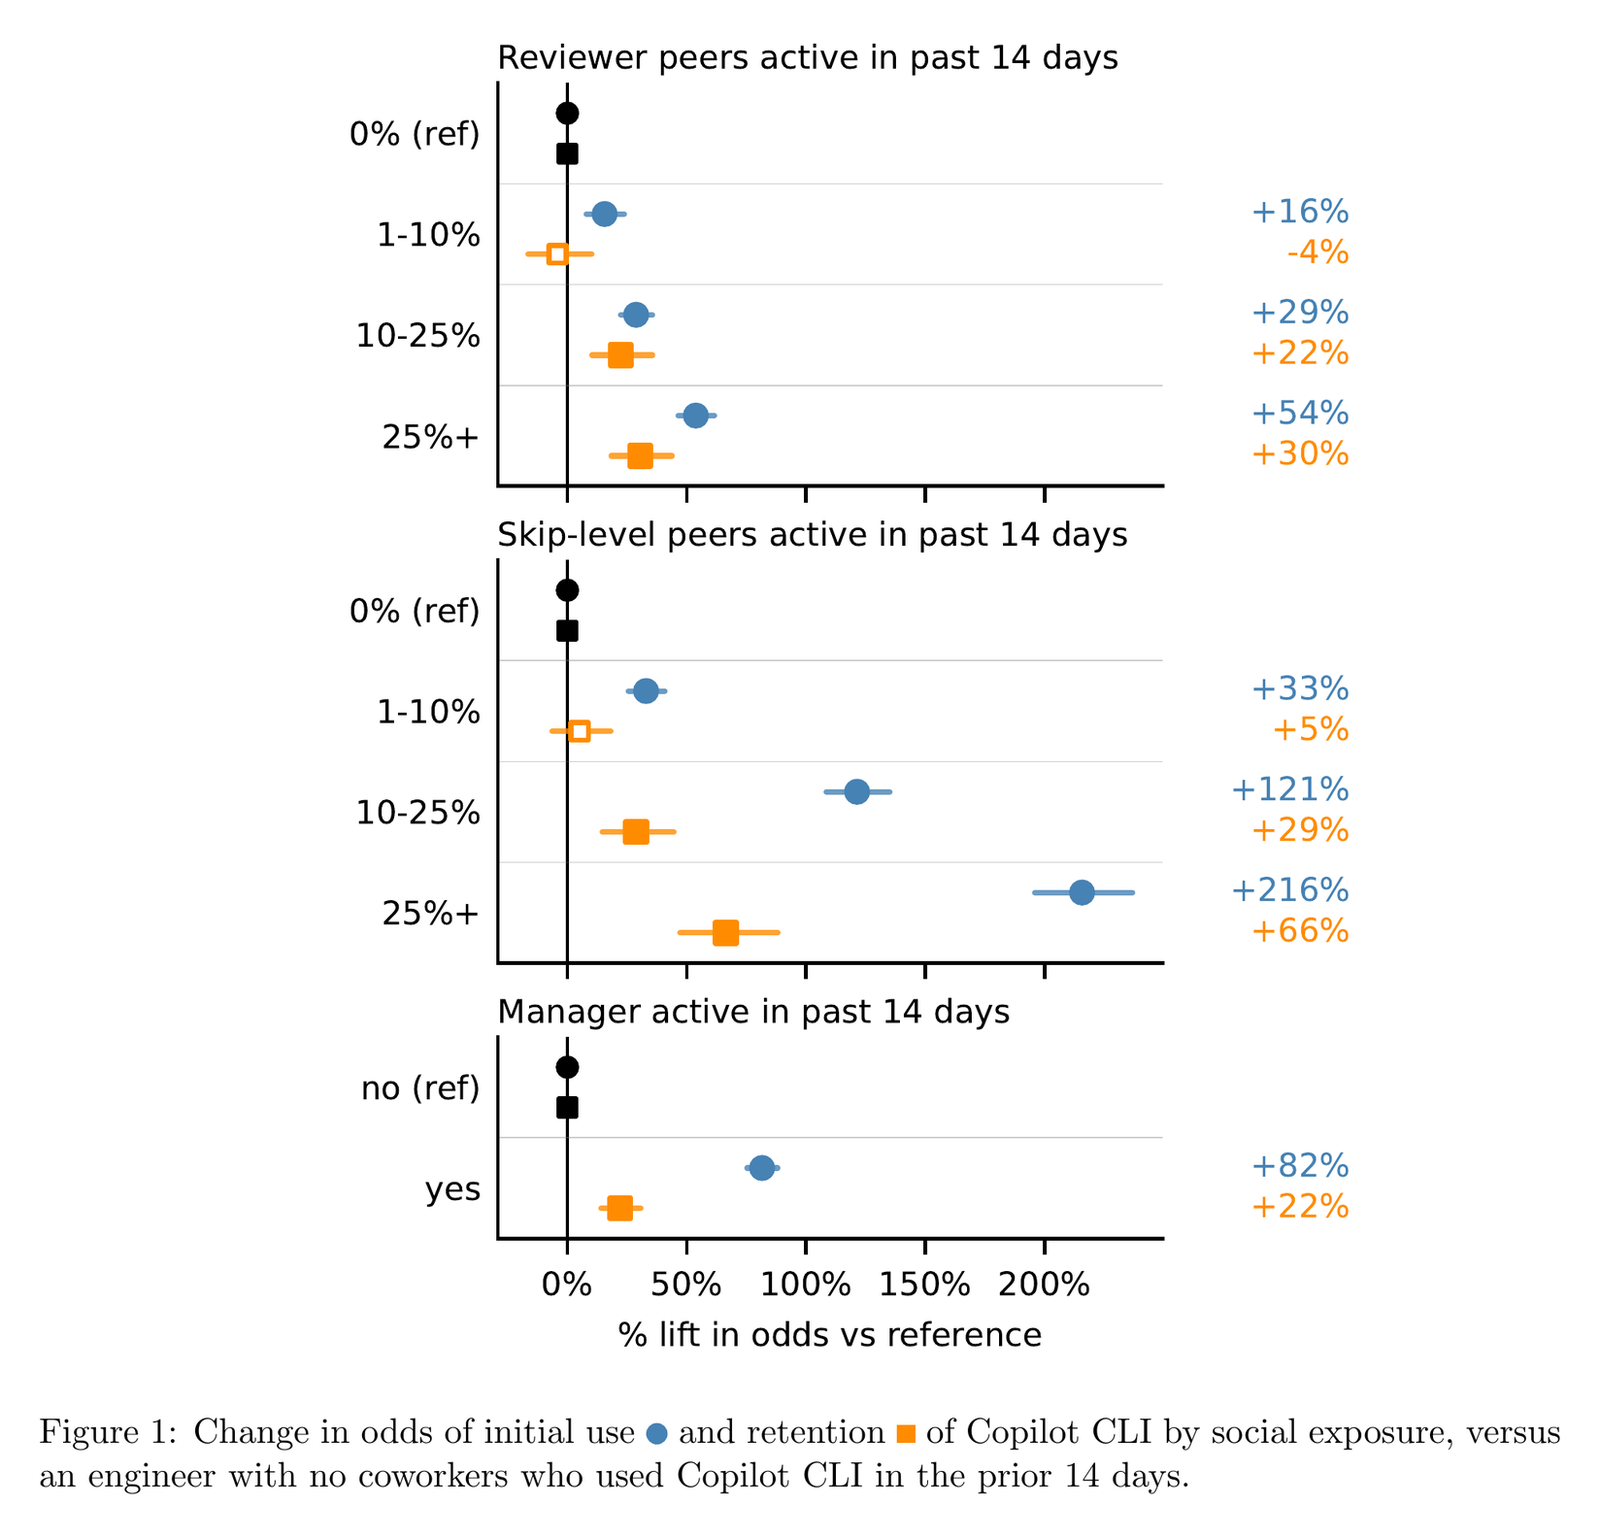
Adoption spreads through the people an engineer works with, more than through role or level. When a skip-level peer or a direct manager uses the tool, the odds that the engineer tries it rise.
The study modeled who tried the tool and who kept it. The strongest predictor was social. The change in the odds that an engineer tries the tool:
- More than a quarter of skip-level peers use it: +216%.
- The direct manager uses it: +82%.
- More than a quarter of reviewer peers use it: +54%.
- Prior IDE Copilot use, light to heavy: +49% to +83%.
What an engineer does explains who adopts and keeps the tool far better than who the engineer is. Peer ties, prior tool use, and PR cadence are the predictors. Treat visible peer use as central to your rollout strategy.
Goal: Replace any target above 25% in your AI business case with a number you can defend, in one sitting.
- Pull days-of-use per engineer per week from your AI tool telemetry for the last month. Bucket engineers at 0 to 2 days, 3 to 4 days, and 5 or more.
- Look up the share of engineers in each bucket. Microsoft’s lifts were +3% to +5%, +15% to +22%, and +50% for those buckets.
- Paste the shares into your coding agent with this prompt:
Prompt
Here is the distribution of AI tool use in our engineering org (share of engineers at 0-2, 3-4, and 5+ days per week). Using Microsoft's 2026 dose-response lifts (+4%, +18%, +50% as bucket midpoints), compute the weighted expected lift in merged PRs for the org. Then show what the org-wide lift would be if the 0-2 bucket moved to 3-4. State both numbers as ranges, not points, and do not add advice. - Put the weighted number next to the target in your business case.
Expected result: an org-wide expected lift in merged PRs, derived from your own usage distribution, sitting beside the target it replaces.
Anthropic engineer’s principles to review agent-written code
Code is now fast to write. The bottleneck is how fast an engineer can be confident in a review.
Addy Osmani is a former Google engineering leader and now an Anthropic engineer. In this lesson, he shows why an agent-written PR costs more to review than a human one. He also shows how much human review each change still needs.
Why agent-written PRs take longer to review
Code review checks an author’s reasoning against the diff. When the author is an agent that keeps no record of what it considered, the reviewer must rebuild that reasoning from the code alone.
To fix this, have the agent state what it tried to do and what it ruled out. Capture that as a decision log on the PR, and a large part of the reconstruction cost disappears. It is a tooling problem, and tooling problems have solutions.
How to decide which PRs still need a human reviewer
Blast radius is how much damage a wrong change can do before someone catches it. The amount of human review a change gets should scale with that damage, not with who or what wrote the code.
Three variables set the amount: blast radius, how long the code lives, and how many people need to understand it. “Human in the loop becomes human on the loop.” You sample, spot-check, and audit the system instead of reading every PR.
Addy Osmani’s seven practices:
- Tier by risk, not by author. A config change earns a linter and a glance. A payments path earns the full stack: types, tests, two different AI reviewers, a human who owns that system, and a security pass.
- Fast-fail the expensive tail. A study of 33,707 agent-authored PRs found reviewer abandonment behind 38% of rejections. Predict high-maintenance PRs from cheap signals before a human looks.
- Raise the bar for what you will even review. Before review, require a statement of what the change is for and a diff far shorter than 3,500 uncommented lines. Require the test output and proof that someone ran it.
- Keep PRs small, deliberately. A diff a human can read is now a design constraint, not a courtesy.
- Read the test changes more carefully than the code. A green check over 200 edited tests means nothing until you confirm the edits were correct.
- Treat CI as the wall that does not move. Agents will weaken CI to make themselves pass. Not out of malice: gradient descent finds the cheapest path to green.
- A human owns the merge. Nobody can page a model or hold it responsible for what it shipped, so whoever clicks merge owns it. Treat every AI review as a sensor, not a verdict: data, not a decision.
For the leader: cut the people who provide that confidence because AI made you faster, and you convert the saving into future incidents.
Goal: Put the three review numbers that a throughput dashboard hides on one page for your org, and set an intake bar for one repo.
- Pull four weeks of PR data. For each repo, compute the share of merged PRs with a human review and the share with a human comment. Add the median hours from PR open to first human review.
- Paste the results into your coding agent with this prompt:
Prompt
Here are per-repo review metrics for the last four weeks: human-review share, substantive (commented) review share, and median hours to first human review. Rank repos by the gap between human-review share and substantive share. Flag any repo where substantive share is under 30% or median hours to first review is over 24. Do not add recommendations. - For the top-ranked repo, add Osmani’s intake bar to the PR template:
Template
## Before requesting review - [ ] One sentence: what this change is for - [ ] Diff is under 400 lines, or split into stacked PRs - [ ] Test output pasted below, with the command that produced it - [ ] If an agent wrote this: what it tried and what it ruled out - Re-run step 1 in four weeks.
Expected result: a ranked list of repos by review thinning, and one repo with an intake bar that pushes intent back onto the author.
The Code: Your daily unfair advantage in software engineering.
Join 350,000+ software engineers, tech leads, and CTOs who start their morning with The Code.
How to decide which of your productivity metrics still hold with AI
AI changed what your productivity metrics measure. It did not change the questions they answer.
A co-author of the SPACE framework, now a distinguished scientist at DX, makes three arguments.
Argument 1: The high-level dimensions of engineering productivity stay remarkably stable, even as AI transforms how teams build software. The questions stay the same:
- How quickly is value delivered?
- How easy is it for developers to do their work?
- How stable are the systems?
- What is the business impact?
Argument 2: Treat AI-specific telemetry as diagnostic context, not as a replacement for outcome measurement. AI adoption, token usage, and tasks assigned to agents are diagnostic telemetry, like PR size or build duration. They answer how the work happens.
The Core 4 answers whether the engineering organization delivers better outcomes. An example:
“if a team’s AI adoption spikes to 90%, that metric alone doesn’t prove success. Instead, it serves as a lens to interpret changes in the Core 4: did that spike in adoption correlate with an increase in speed? Did it negatively impact quality via a higher change failure rate? Or did it inadvertently degrade developer effectiveness by introducing new code-review bottlenecks?”
Argument 3: AI changes the behaviors that generate traditional metrics, so triangulate across diagnostic, system, and outcome layers. Pull request counts spike, cycle times compress, and code volumes bloat. Leaders who chase these surface fluctuations without an outcome-oriented framework optimize for motion rather than progress.
Outcome-based developer experience metrics may now be the most reliable ledger for proving AI value.
How to pair each speed metric with a quality counterweight
A counterweight is a second metric that moves the other way when someone games or misreads the first one. A speed metric on its own cannot tell acceleration from recklessness.
DX’s Q2 data produces four explicit rules. Click each pair for why it matters and what to track:
Pair 1Every speed metric with a quality counterweight
Why it matters. If change failure rate climbs at the same time for a meaningful subset of companies, some organizations are simply shipping defects faster. Speed without quality discipline is recklessness, not acceleration.
What to track. Deploy frequency up 60% is an incomplete picture on its own. Track change failure rate, recovery time, and rollback frequency beside it.
Pair 2Time savings with the innovation ratio
Why it matters. An engineer who saves 5 hours a week and spends them in extra meetings produces no net value from the AI investment. Over four quarters, time savings per engineer grew past six hours a week while the innovation ratio held at 57% to 58%.
What to track. Track time on new features against maintenance. If the ratio does not move upward despite throughput gains, you have a prioritization problem, not a tooling problem.
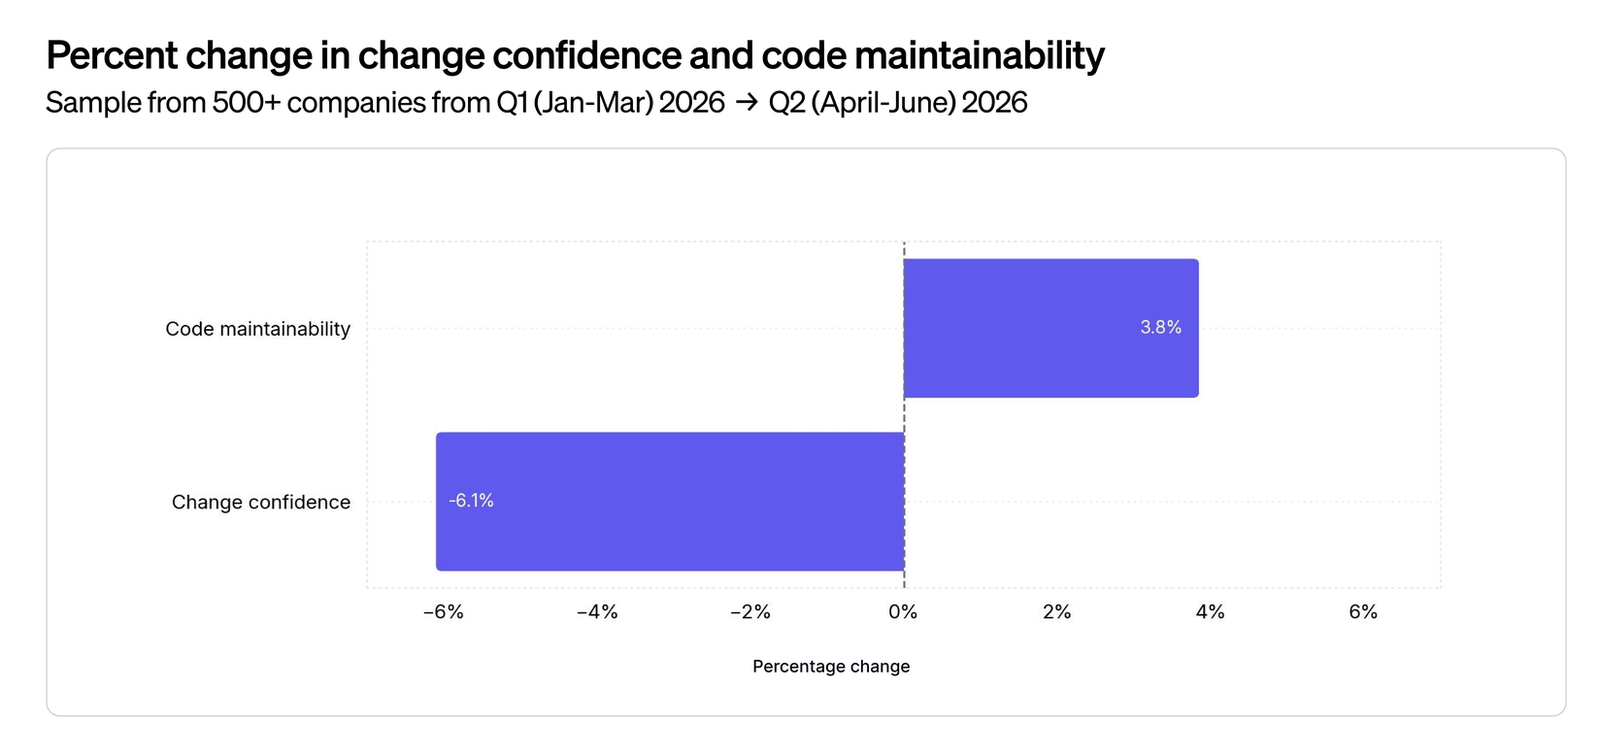
Pair 3Change confidence with code maintainability
Why it matters. These two moved together in the past and are now in tension. Maintainability rose 3.8% while change confidence fell 6.1%. Engineers feel deeply accountable for what ships. When something is high-risk or hard to undo, they pull back on agentic velocity. The behavior is human, not irrational, and hard to get over.
What to track. Track both. Code that is easier to read but harder to trust shows up in this pair first.
Pair 4Failure rate with recovery time
Why it matters. A team can tolerate a higher failure rate if recovery is fast and automated. Even a low failure rate becomes costly if each incident takes hours of manual work.
What to track. Track recovery time beside failure rate. One hypothesis to test: failures from AI-authored code may be more diffuse and harder to trace, and the risk rises when the developer who merged the PR did not fully understand the code.
Why five health metrics, from merge rate to PR size, may now mislead
A metric misleads when the behavior behind it changes while the reading stays the same. Several metrics that signaled health before AI now need a second look.
Two changed meaning.
On PR merge rate:
“Historically, a high merge rate signaled a highly aligned team shipping clean, uncontroversial work. In an agentic workflow, does a 95% merge rate mean the AI is flawless? Or does it mean your human developers are rubber stamping machine-generated code because they’re too overwhelmed to properly review it?”
On time to 10th PR:
An AI onboarding assistant can help an engineer ship 10 PRs by their second afternoon. The metric then no longer captures structural onboarding health.
PR throughput splits by level. At the individual level the criticism is fair, because not all PRs are equal. At the system level it stays one of the most useful signals, because it measures engineering flow. When code stalls because review is a bottleneck, builds are flaky, or deployment is slow, the metric surfaces that too.
DX’s Q2 report adds three more. PR size nearly doubled during AI adoption and can serve as an early indicator of tech debt. The segments that lead on speed are not the segments that lead on perceived quality.
Five metrics that used to signal health may now mislead. Click each for what it used to mean and what it may mean now:
Metric 1Merge rate
Used to mean. An aligned team shipping clean work.
May now mean. Rubber-stamping under overload.
Metric 2Time to 10th PR
Used to mean. Onboarding health.
May now mean. An AI assistant shipping by the second afternoon.
Metric 3PR throughput
Used to mean. Individual output.
May now mean. Valid only at the system level, as a flow signal.
Metric 4PR size
Used to mean. Normal variation.
May now mean. An early indicator of tech debt.
Metric 5Perceived quality
Used to mean. Tracked speed.
May now mean. Now diverges from it.
Time to 10th PR moved in one direction. It fell from 39 days in Q3 2025 to 33 days in Q4 2025, and it has more than halved since Q1 2024.
Goal: Sort every metric on your current AI dashboard into a layer, and find the speed metrics with no counterweight, in under an hour.
- List every metric on your AI dashboard and your engineering dashboard, one per line.
- Paste the list into your coding agent with this prompt:
Prompt
Here is a list of metrics from our engineering and AI dashboards. Classify each as one of: diagnostic (how work is performed: adoption, tokens, PR size, tasks to agents), system (flow: throughput, cycle time, merge rate), or outcome (DX Core 4: speed, effectiveness, quality, impact). Then list every speed or throughput metric that has no paired quality metric on the same dashboard (change failure rate, recovery time, rollback frequency, change confidence). Finally, flag any metric reported at the individual developer level. Do not add recommendations. - For each unpaired speed metric, add the counterweight DX names to the same view.
- Remove or aggregate any metric reported per individual.
Expected result: every metric assigned to a layer, no speed metric without a quality pair, and no individual-level reporting.
By this point you should have:
- A defensible expected lift for your organization, derived from your own usage distribution.
- The three review metrics a throughput dashboard hides, per repo, and an intake bar on one PR template.
- Every dashboard metric assigned to a layer, with no speed metric left without a quality pair and no individual-level reporting.
Module 3: SDD at Org Scale
How to make the input to all of this better. It covers specifications that an agent, an engineer, a test suite, and a reviewer can each act on. It also covers how to run that at the scale of an organization.